8. Multi-species models#
Dengue#
For Dengue Fever, we’ll follow work from this manuscript = A model of dengue fever.
We suppose that there exists in the system two species who can transfer the dengue virus to one another: human (\(h\)) and mosquitoes (\(m\)). Mathematical models for multi-species often explore how manipulating the non-human animal population can reduce disease. This is for many reasons but one primary reason is that its very hard for humans to change their behaviors to prevent disease.
The model present for dengue assumes homogeneous mixing between both species.
The dengue virus is passed from an infected mosquito to a human via a bite. To understand how the pathogen might be transmitted at the population level we should attempt to understand the probability of transmission when a human is bit and also the average number of bites per infected mosquito.
The authors assume that infected mosquitoes bite one human per day \((b_{i} = 1)\), and that susceptible (not yet infected) mosquitoes bite 0.75 humans per day \((b_{s}=0.75)\). There is evidence that infected mosquitoes do bite more frequently.
There is also previous evidence that suggests the probability of transmission from humans to mosquitoes; \(p_{h\to m}\); (and vice-versa; \(p_{m\to h}\)) is 0.75.
Then the probability that a human is infected by a mosquito in a small interval of time \(\Delta t\) is estimated for humans as
and so the average rate of infections among all susceptible humans is
where we defined \(\beta_{m \to h} = p_{m\to h} b_{i}\). We see that the rate at which susceptibles move to the infected state—called the force of infection—depends on how often infected mosquitoes bit, the probability of transmission when they do bite, and the number of mosquitoes per person \((\frac{I_{m}}{N_{h}})\).
We can take a similar approach to define the change in infected humans and removed humans. Because we are studying to species we also need to define the change in susceptible and infected mosquitoes.
When a mosquito is infected with the dengue virus they never clear it. That is, mosquitoes are either susceptible or infected. Just like with the human population, we define the change in susceptible and infected mosquitoes as
where the rate of movement from susceptible to infectious depends on the fraction of infected humans \(\frac{I_{h}}{N_{h}}\). Mosquitoes do not infect one another. They acquire an infection by, in this model, biting an infected human.
The full set of differential equations has five states
To complete our model specification we need initial conditions so each of the five states. The manuscript linked above suggests that a reasonable number of humans is 5000 and mosquitoes 50,000. We will also use the same parameter values that were derived in the linked manuscript
Name of the parameter |
Notation |
Base value |
|---|---|---|
Transmission probability of vector to human |
\(p_{hv}\) |
0.75 |
Transmission probability of human to vector |
\(p_{vh}\) |
0.75 |
Bites per susceptible mosquito per day |
\(b_{s}\) |
0.5 |
Bites per infectious mosquito per day |
\(b_{i}\) |
1.0 |
Effective contact rate, human to vector |
\(\beta_{h \to m}\) |
0.375 |
Effective contact rate, vector to human |
\(\beta_{m \to h}\) |
0.75 |
Human life span |
\(1/\mu_{h}\) |
25000 days |
Vector life span |
\(1/\mu_{m}\) |
4 days |
Host infection duration |
\(1/\gamma\) |
3 days |
Demography#
We need to add to our model one more important component—demographics.
The lifespan of humans and mosquitoes is quite different.
On average a human may live 65 years or so but mosquitoes typically live 4 days.
To account for this, we need to model the birth and death of humans and mosquitoes (irrespective of disease state).
We will assume that humans are born at a rate of \(\mu_{h}\) and mosquitoes \(\mu_{m}\). Likewise, we will also assume both species die at that same rate. This is a simplifying assumption. Though species enter and exit the system the number of each species stays constant.
Lets add birth and death process to the above system of equations:
import numpy as np                     #--for array and matrix computations
from scipy.integrate import solve_ivp  #--needed to solve the ODE system
import matplotlib.pyplot as plt        #---for plotting

def dengue(t,y
           ,beta__h2m
           ,beta__m2h
           ,gamma
           ,nh
           ,nm
           ,muh ):
    sh,ih,rh,  sm,im = y  #<- We assume that y holds state values s,i,r etc at each tiny time step

    dsh_dt =   muh*nh -beta__h2m*sh*(im/nh) - muh*sh
    dih_dt =           beta__h2m*sh*(im/nh) - gamma*ih
    drh_dt =   gamma*ih                     - muh*rh

    dsm_dt =   mum*nm -beta__m2h*sm*(ih/nh) - mum*sm
    dim_dt =           beta__m2h*sm*(ih/nh) - mum*im

    #Its our job to compute the derivatives and return them as a list
    return [dsh_dt, dih_dt, drh_dt,  dsm_dt, dim_dt ]

start = 0    #--start at time 0
end   = 8030   #--end   at time 200

beta__h2m = 0.75
beta__m2h = 0.375

gamma     = 1./3
muh       = 1./25000
mum       = 1./4

nh = 10*10**3
nm = 10*10**4

S0h = nh*(1-0.0001)
I0h = nh*0.0001
R0h = 0

S0m = nm*(1-0.0001)
I0m = nm*0.0001

initial_conditions = (S0h,I0h,R0h, S0m,I0m  )

solution = solve_ivp( fun     = dengue
                     , t_span = (start,end)
                     , y0     = initial_conditions
                     , args   = (beta__h2m,beta__m2h,gamma,nh,nm,muh) )

#--Extract solutions from the object called "solution"
times = solution.t
St_h    = solution.y[0,:] #<-first row  is S
It_h    = solution.y[1,:] #<-first row  is S
Rt_h    = solution.y[2,:] #<-first row  is S

St_m    = solution.y[3,:] #<-first row  is S
It_m    = solution.y[4,:] #<-first row  is S

#--plot the results
plt.plot(times,It_h, label = "Ih(t)")

plt.xlabel("Time")
plt.ylabel("Frequency")
plt.legend()
<matplotlib.legend.Legend at 0x7f0a7b27bd50>

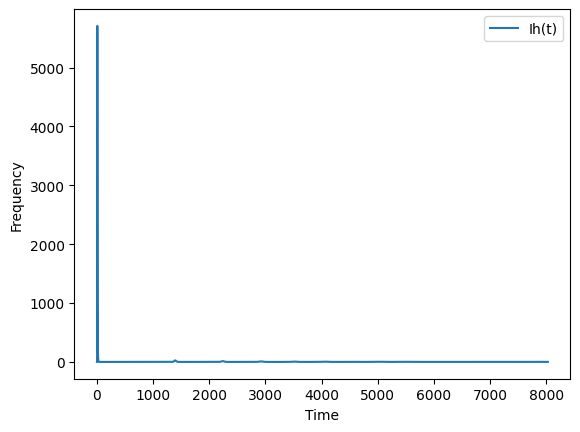
Above is a plot of the number of human infections over 22 years (8030 days). We see initially an intense rise in infections and then no more—or maybe not. If we look closely, it seems like there may be smaller activity after the first year.
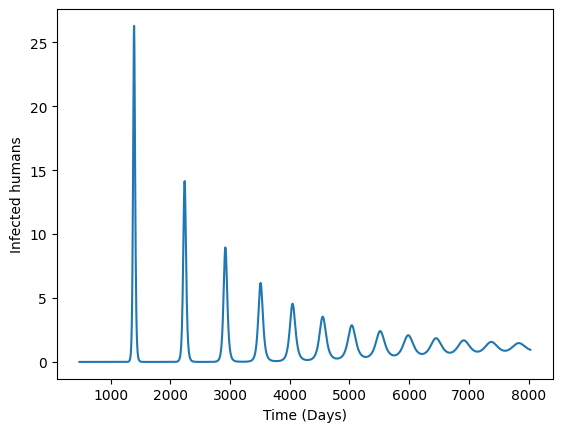
Lets plot the number of infections after the first few years.
fig,ax = plt.subplots()
ax.plot(times[100:],It_h[100:])
ax.set_xlabel("Time (Days)")
ax.set_ylabel("Infected humans")
plt.show()

Our model shows periodic spikes of infections in the human population that slowly die down over a decade. This is periodic behavior is a result of the different in lifespan between mosquitoes and humans. Humans are entering the system susceptible and present for a much longer time than mosquitoes. This replenishment of susceptibles reaches a critical point where an outbreak occurs. Susceptibles are depleted and the process starts again.
Homework#
The homework exercises are heavily inspired by work from Keeling and Rohani.
The ratio of humans to mosquitoes: An important quantity is the ratio of the number of mosquitoes to the number of humans in the system. Lets investigate, computationally, how changing this ratio impacts the dynamics of the number of infected humans over time.
Run the above model and set the number of mosquitoes to \(10\times 10^4\) and humans to \(1\times 10^4\)
Run the above model and set the number of mosquitoes to \(10\times 10^4\) and humans to \(2\times 10^4\)
Run the above model and set the number of mosquitoes to \(10\times 10^4\) and humans to \(5\times 10^4\)
Run the above model and set the number of mosquitoes to \(10\times 10^4\) and humans to \(10\times 10^4\)
How is the number of human infections changing after the initial increase (ie plot the numnber of infections after 100 time points).
Why do you think infections are changing like this?
Computing the basic reproduction number for vector-borne diseases In one species model we can reason about the basic reproduction number by setting the system to one infector (rest susceptible), and multiplying the number of infections by the infectious period. For the Dengue model, the basic reproduction number is the average number of secondary infected mosquitoes generated by a single infected mosquito. For multi-species models, like Dengue, we need to proceed in two steps.
Assuming a single mosquito infected mosquito, compute the average number of humans they will infect using the above system of differential equations. Hint: This should be the average rate of bites that result in infection of a human multiplied by the mosquitoes life span. Hint2: This equation tells us about the number of infected humans.
(8.7)#\[\begin{align} \frac{dI_{h}}{dt} &= \beta_{m \to h} S_{h} \frac{I_{m}}{N_{m}} - \gamma I_{h} - \mu_{h}I \end{align}\]Now, compute the number of mosquitoes infected as a result of a single infectious human by multiplying the transmission from an infected human to mosquito times the length of time a human is infectious. Hint: This equation tells us about the number of infected mosquitoes in general.
(8.8)#\[\begin{align} \frac{dI_{m}}{dt} &= \beta_{h \to m} S_{m} \frac{I_{h}}{N_{h}} \end{align}\]We want to know the number of infected mosquitoes when they are all susceptible (when \(S_{m} = N_{m}\)) and when there is a single infected humans \((I_{h}=1)\).
Finally, compute the reproduction number as (a) multiplied by (b). Simplify if needed.
Compute the reproduction number for our above Dengue example.
Humans vs mosquitoes. The ratio of the number of mosquitoes to humans is an important quantity in muliti-species models like the vector-borne model that is presented. Lets see why.
You computed the reproduction number \(\mathcal{R}_{0}\) from (2). We know that when an outbreak takes place when \(\mathcal{R}_{0} > 1\). Starting from \(\mathcal{R}_{0}>1\) plug in the expression you arrived at for (2) and solve so that the ratio of mosquitoes to humans is on one side of the inequality.
Using the parameters for Dengue above, please compute the number of mosquitoes per human needed to begin an outbreak. Is this number of mosquitoes per person likely in most regions of the world? Discuss.